News

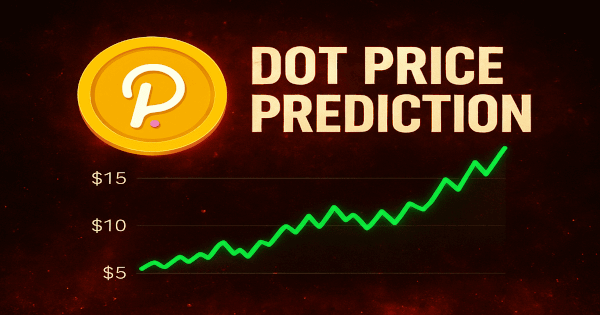
ARB Price Prediction: Targets $0.12 Recovery by May 2026
Crypto News
 3 days ago
3 days ago APT Price Prediction: Targets $0.95 Recovery by Late April as Aptos Tests Critical Support
Crypto News
3 days ago
3 days ago 
Dmail Network to Cease Operations Following Five Years of Service
Crypto News
 3 days ago
3 days ago 
NEAR Price Prediction: Targets $1.35-$1.50 Range by May 2026
Crypto News
3 days ago
3 days ago XLM Price Prediction: Stellar Targets $0.18 Breakout Amid Mixed Signals by Mid-April
Crypto News
3 days ago
3 days ago 
TRX Price Prediction: Targets $0.35-$0.40 by May 2026 as Technical Momentum Builds
Crypto News
3 days ago
3 days ago 
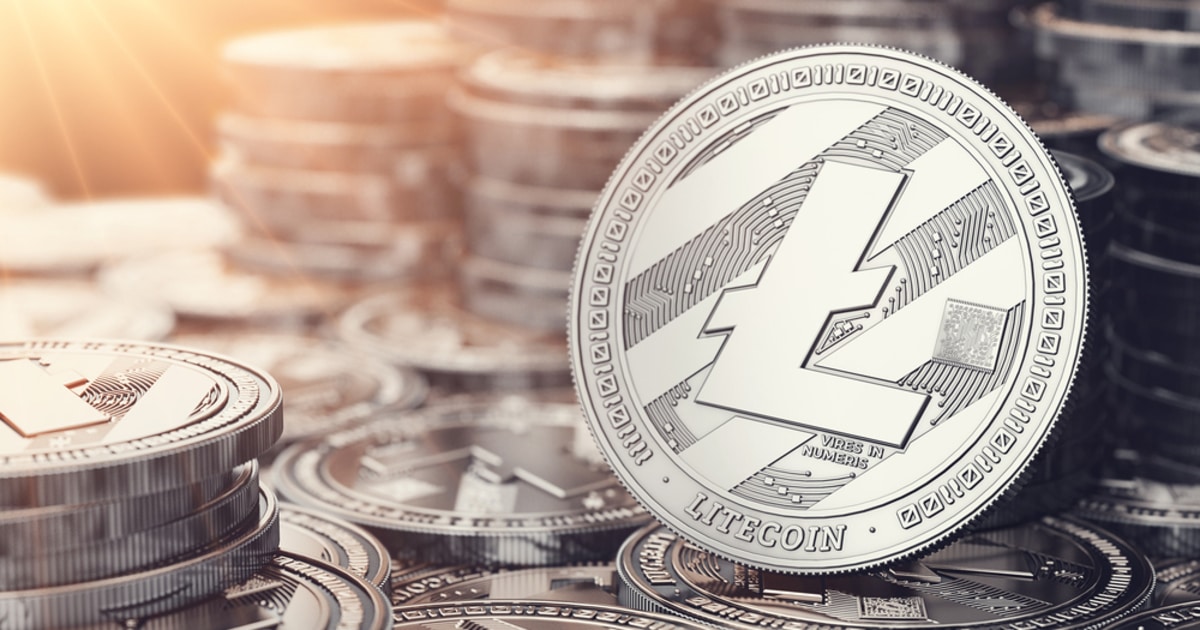
LTC Price Prediction: Targets $57-60 Recovery by May 2026
Crypto News
3 days ago
3 days ago ATOM Price Prediction: Cosmos Faces Critical Support Test at $1.66 Amid Bearish Momentum
Crypto News
3 days ago
3 days ago 
Why Rising Japanese Bond Yields Are Becoming Bitcoin’s Hidden Macro Driver
Crypto News
 3 days ago
3 days ago 
UNI Price Prediction: Targets $3.85-$4.00 Recovery by May 2026
Crypto News
3 days ago
3 days ago 
LINK Price Prediction: Chainlink Eyes $9.50 Breakout Amid Technical Reset
Crypto News
3 days ago
3 days ago 
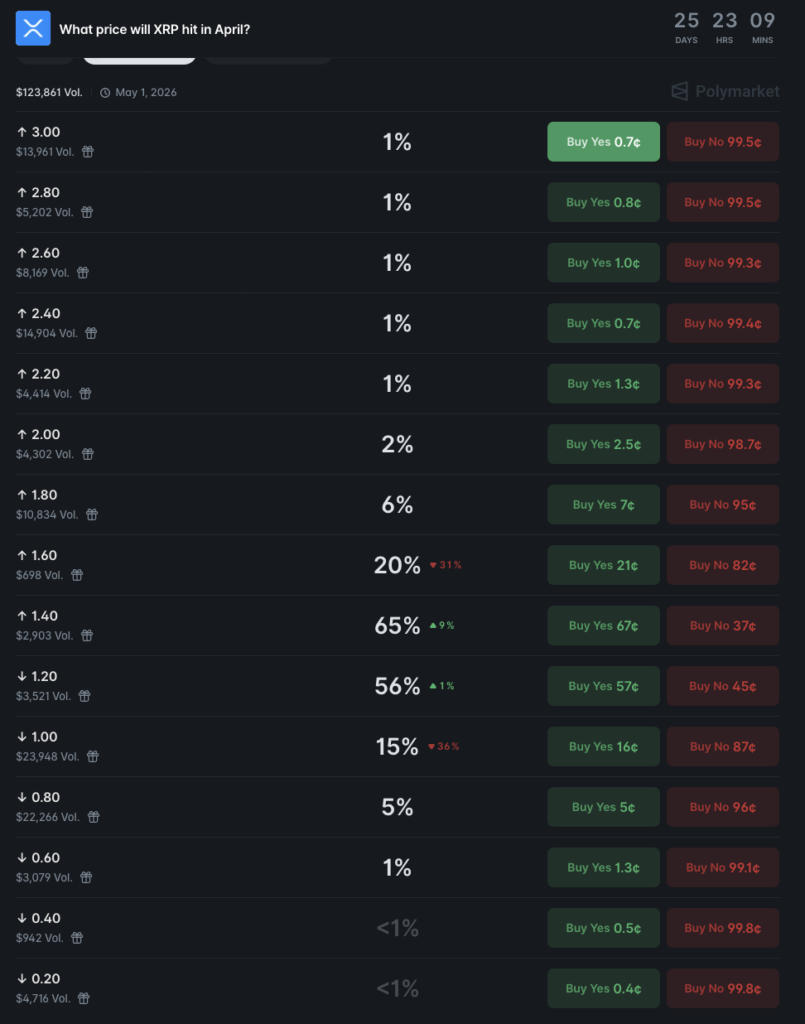
Crypto markets predict XRP’s price for end of April
Crypto News
 3 days ago
3 days ago 

MATIC Price Prediction: Polygon Targets $0.42-$0.45 Recovery by May 2026
Crypto News
3 days ago
3 days ago 
DOGE Price Prediction: Dogecoin Eyes $0.10 Breakout Amid Neutral Technical Setup
Crypto News
3 days ago
3 days ago 
SOL Price Prediction: Solana Eyes $73 Target Amid Technical Breakdown
Crypto News
3 days ago
3 days ago 
Week Ahead: It's Still Mostly About The War
Crypto News
3 days ago
3 days ago 
ADA Price Prediction: Cardano Eyes $0.38 Breakout by Mid-2026 Despite Current Consolidation
Crypto News
3 days ago
3 days ago 
Anthropic launches PAC amid tensions with Trump administration over AI policy
Crypto News
 3 days ago
3 days ago 

BNB Price Prediction: Targets $620 Recovery by May 2026 Despite Current Bearish Momentum
Crypto News
3 days ago
3 days ago 
ETH Price Prediction: Ethereum Targets $2,200-$2,400 Range by May 2026
Crypto News
3 days ago
3 days ago 
BTC Price Prediction: Bitcoin Eyes $70,000 Recovery Despite Current Bearish Momentum
Crypto News
3 days ago
3 days ago 
Cambodian Parliament Approves New Law Imposing Life Sentences for Crypto Scammers
Crypto News
3 days ago
3 days ago 
The Great Crypto Heist: Central Banks Are Getting the Infrastructure for Free
Crypto News
3 days ago
3 days ago 
Review: Heatbit Maxi Bitcoin Miner and Heater
Crypto News
3 days ago
3 days ago 
Drift Protocol $280M exploit took 'months of deliberate preparation'
Crypto News
3 days ago
3 days ago 
Federal Reserve Set to Hold Rates as Markets Fully Price out 2026 Cuts
Crypto News
3 days ago
3 days ago 
FPIs extend selloff in April; pull out Rs 19,837 crore in just 2 sessions
Crypto News
3 days ago
3 days ago 

Defying US Criticism, Brazil Mulls Pix's Globalization
Crypto News
3 days ago
3 days ago 
Bitcoin reaches highest level of bearish chatter in 5 weeks: Santiment
Crypto News
3 days ago
3 days ago 

Iran war hits kitchens as shilling slumps, forex reserves dwindle
Crypto News
3 days ago
3 days ago 
Green List: Japan Anchors 30+ Crypto Tokens in Regulated Framework
Crypto News
3 days ago
3 days ago 
Blockchain group eyes won stablecoin launch after Korea rules
Crypto News
3 days ago
3 days ago 
The US-Iran war is more of a geoeconomic game and less of a geopolitical one
Crypto News
3 days ago
3 days ago 
Is XRP The Solution To Everything? Ripple President Drops Bombshell That Changes Everything
Crypto News
3 days ago
3 days ago 
'History Has Arrived': Robert Kiyosaki Names Bitcoin Among Safest Investments in 2026
Crypto News
3 days ago
3 days ago 

Tether Issues 14-Day Deadline In High-Stakes $500 Billion Deal
Crypto News
3 days ago
3 days ago 

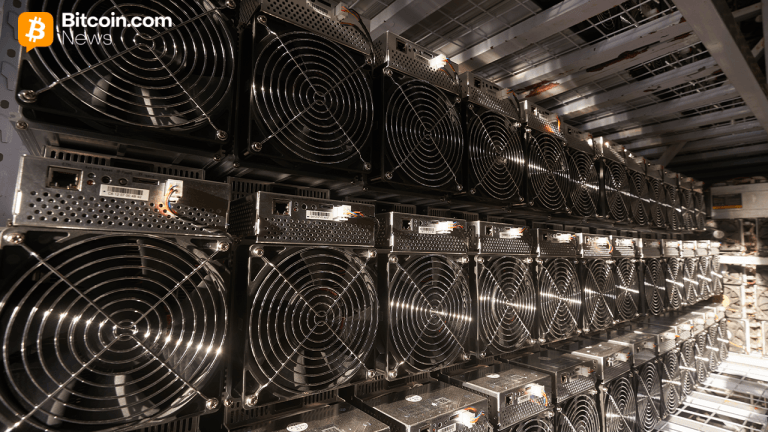
Bitcoin Difficulty Climbs 3.87% as Hashrate Slips and Next Cut Looms
Crypto News
3 days ago
3 days ago 
Human.tech Unveils Natural Language Wallet Protocol for AI Agents
Crypto News
3 days ago
3 days ago 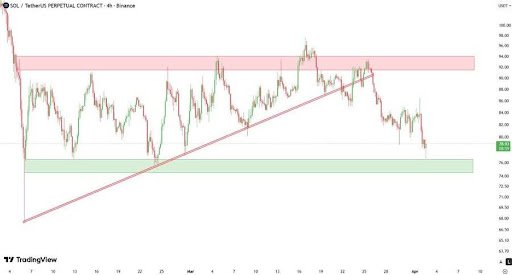
Solana Under Pressure At $75–$78, But Bulls Eye Massive Upside Ahead
Crypto News
3 days ago
3 days ago Popular


Stocks and Geopolitical Conflict
22 hours ago