
Algorand Just Bounced Off Its All-Time Low, and the Chart Still Looks Rough
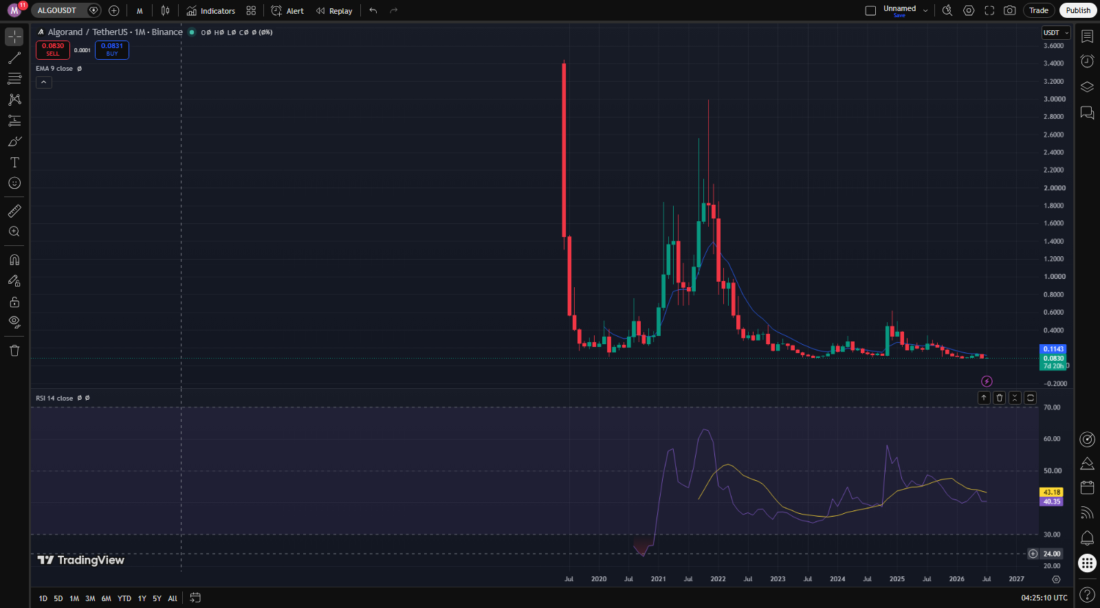
Algorand sits a few cents above the all-time low it set back in March, and the six-timeframe chart shows a coin stuck between chop and a slow bleed.
Pulled up the ALGOUSDT chart this week, and honestly the first thing worth flagging has nothing to do with trend lines. Algorand’s trading something like three and a half percent above its all-time low, which isn’t exactly a flex for a coin that once changed hands above three dollars.
And that low isn’t some 2020 relic either. It printed March 29, four months back now. $0.0797, if you’re curious. Price has mostly just failed to get away from it since.
Still Living Off a 2019 Peak
Zoom out to the monthly chart and there’s a number that does a lot of the talking, 97.7 percent, that’s roughly the gap between where ALGO sits now and the $3.56 it touched back in June of 2019. Seven years later and this thing is still getting introduced by its worst chart, which feels almost unfair at this point.
Monthly RSI, for what it’s worth, reads 43.
Below fifty. Drifting. No divergence forming against price that I can see, at least not yet. That’s not oversold so much as it’s just tired, the kind of reading you get when a chart’s been losing altitude for so long that nobody’s really bothering to buy the dip anymore, they’ve moved on.
… Continue reading the full article at the original source below.